Griddap
Erddapy can access gridded datasets, using the server-side subsetting of griddap or the OPeNDAP response, to download only the parts of a dataset that the user requires.
In our example we will use a Region of Interest (ROI) to extract data within its bounds. First we need to read the ROI with geopandas. Let’s use the South Atlantic Ocean basin from Natural Earth as our ROI.
[1]:
import geopandas
import pooch

url = "https://naturalearth.s3.amazonaws.com/4.1.1/50m_physical/ne_50m_geography_marine_polys.zip"
fname = pooch.retrieve(
    url,
    known_hash="db6f59e5a747c016451caec2450db6deea25d702dc2fb9c39384c1b909fb7f72",
)

oceans = geopandas.read_file(fname)

name = "South Atlantic Ocean"
SA = oceans.loc[oceans["name"] == name]
Downloading data from 'https://naturalearth.s3.amazonaws.com/4.1.1/50m_physical/ne_50m_geography_marine_polys.zip' to file '/home/runner/.cache/pooch/f076ff648997d7b0fc77283e51b7d78d-ne_50m_geography_marine_polys.zip'.
When accessing gridded datasets we need to define the protocol="griddap" in our class instantiation.
[2]:
from erddapy import ERDDAP

e = ERDDAP(
    server="https://erddap.ioos.us/erddap",
    protocol="griddap",
)

e.dataset_id = "etopo5_EDDGridCopy"
CAVEAT: Note that ERDDAP can serve gridded data with longitudes in the 0–360 format or -180–180. The user must inspect the dataset and modify your query accordingly.
Information on the griddap dataset is fetched automatically and the variables and constraints properties for that dataset are filled using ERDDAP’s defaults.
[3]:
import json

constraints = json.dumps(e.constraints, indent=1)

print(f"variables in this dataset:\n\n{e.variables}")
print(f"\nconstraints of this dataset:\n\n{constraints}")
variables in this dataset:

['ROSE']

constraints of this dataset:

{
 "latitude>=": "-90.0",
 "latitude<=": "90.0",
 "latitude_step": "1",
 "longitude>=": "0.0",
 "longitude<=": "359.91999999999996",
 "longitude_step": "1"
}
ERDDAP’s standard subsetting return all variables at the most recent timestep and every point of the remaining dimensions.
This can result in large data requests! However, the values of the constraints can be changed and variables dropped before data set is downloaded. Here we will download only one variable from that list.
[4]:
e.constraints["latitude_step"] = 10
e.constraints["longitude_step"] = 10

constraints = json.dumps(e.constraints, indent=1)
print(f"\nconstraints of this dataset:\n\n{constraints}")
constraints of this dataset:

{
 "latitude>=": "-90.0",
 "latitude<=": "90.0",
 "latitude_step": 10,
 "longitude>=": "0.0",
 "longitude<=": "359.91999999999996",
 "longitude_step": 10
}
The user can reset to the defaults with griddap_initialize().
[5]:
e.griddap_initialize()

constraints = json.dumps(e.constraints, indent=1)
print(f"\nconstraints of this dataset:\n\n{constraints}")
constraints of this dataset:

{
 "latitude>=": "-90.0",
 "latitude<=": "90.0",
 "latitude_step": "1",
 "longitude>=": "0.0",
 "longitude<=": "359.91999999999996",
 "longitude_step": "1"
}
[6]:
e.variables = [e.variables[0]]

print(f"Downloading {e.variables}.")
Downloading ['ROSE'].
And we will reduce the dataset a bit further by requesting only the data that is inside the bounding box of the South Atlantic.
[7]:
SA.bounds
[7]:
| minx | miny | maxx | maxy | |
|---|---|---|---|---|
| 6 | -69.092082 | -60.533462 | 19.634854 | 0.032867 |
[8]:
def bounds2contraints(bounds):
    return {
        "longitude>=": 360 - abs(SA.bounds.minx.squeeze()),
        "longitude<=": 360 - abs(SA.bounds.maxx.squeeze()),
        "latitude>=": bounds.miny.squeeze(),
        "latitude<=": bounds.maxy.squeeze(),
    }


e.constraints.update(bounds2contraints(SA.bounds))
e.constraints
[8]:
{'latitude>=': np.float64(-60.53346241642455),
 'latitude<=': np.float64(0.03286652261984102),
 'latitude_step': '1',
 'longitude>=': np.float64(290.90791792128266),
 'longitude<=': np.float64(340.3651464501071),
 'longitude_step': '1'}
Note the new longitude/latitude limits in the query above. New can download the data into an xarray.Dataset object.
[9]:
%%time


ds = e.to_xarray()
CPU times: user 182 ms, sys: 19.4 ms, total: 202 ms
Wall time: 544 ms
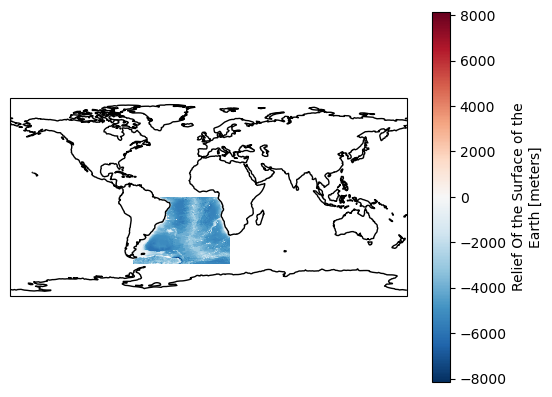
Once downloaded data can be quickly visualised with xarray’s inbuilt plotting functionality.
[10]:
import cartopy.crs as ccrs
import matplotlib.pyplot as plt

fig, ax = plt.subplots(subplot_kw={"projection": ccrs.PlateCarree()})
ds["ROSE"].plot(ax=ax)
ax.coastlines();
Note that we did not extract the exact ROI but instead we downloaded what is inside a square defined by its bounds. We can refine the data selection using region mask and download strictly what is inside th ROI.
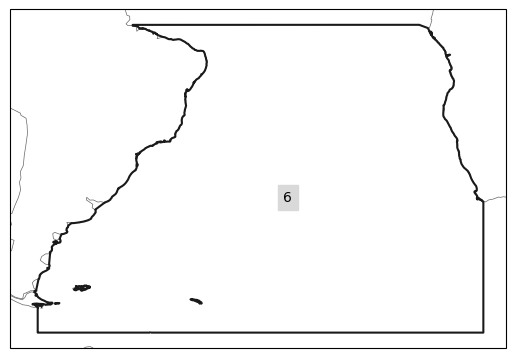
[11]:
import regionmask

region = regionmask.from_geopandas(SA, name=name)
region.plot();
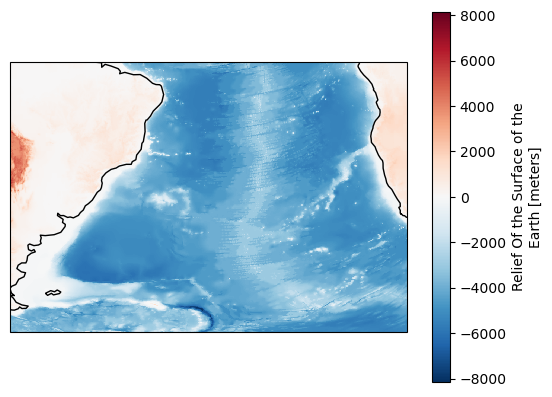
[12]:
mask = region.mask(
    ds["longitude"],
    ds["latitude"],
)


fig, ax = plt.subplots(subplot_kw={"projection": ccrs.PlateCarree()})
ds["ROSE"].where(mask == region.numbers[0]).plot(ax=ax)
ax.coastlines();
Now we have data only for the Atlantic Ocean, no land data in our plot.
Subset after the request with OPeNDAP
ERDDAP server-side subsetting can be avoided by specifying the OPeNDAP protocol. This is a good choice if you intend to use a full dataset or subset it after the request.
Note that most OPeNDAP clients will eagerly download only the coordinates, making a post request subset almost as fast as serve-side subset.
[13]:
e = ERDDAP(
    server="https://erddap.ioos.us/erddap",
    protocol="griddap",
    response="opendap",
)

e.dataset_id = "etopo5_EDDGridCopy"
[14]:
%%time

ds = e.to_xarray()
CPU times: user 10.7 ms, sys: 2.98 ms, total: 13.6 ms
Wall time: 266 ms
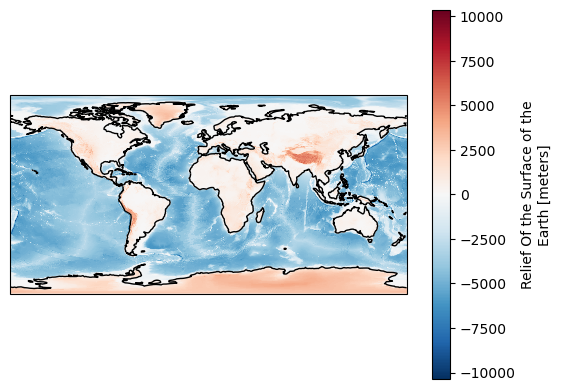
Let’s take a quick look at the data.
[15]:
%%time

projection = ccrs.PlateCarree()

fig, ax = plt.subplots(subplot_kw={"projection": projection})
ds["ROSE"].plot(ax=ax)
ax.coastlines();
CPU times: user 7.83 s, sys: 375 ms, total: 8.21 s
Wall time: 23 s
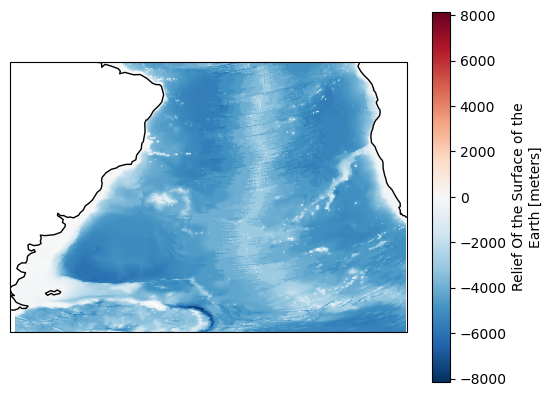
[16]:
mask = region.mask(
    ds["longitude"],
    ds["latitude"],
)


fig, ax = plt.subplots(subplot_kw={"projection": ccrs.PlateCarree()})
ds["ROSE"].where(mask == region.numbers[0]).plot(ax=ax)
ax.coastlines();