These diagrams show the current HFRNet “as-is” system.
Overview
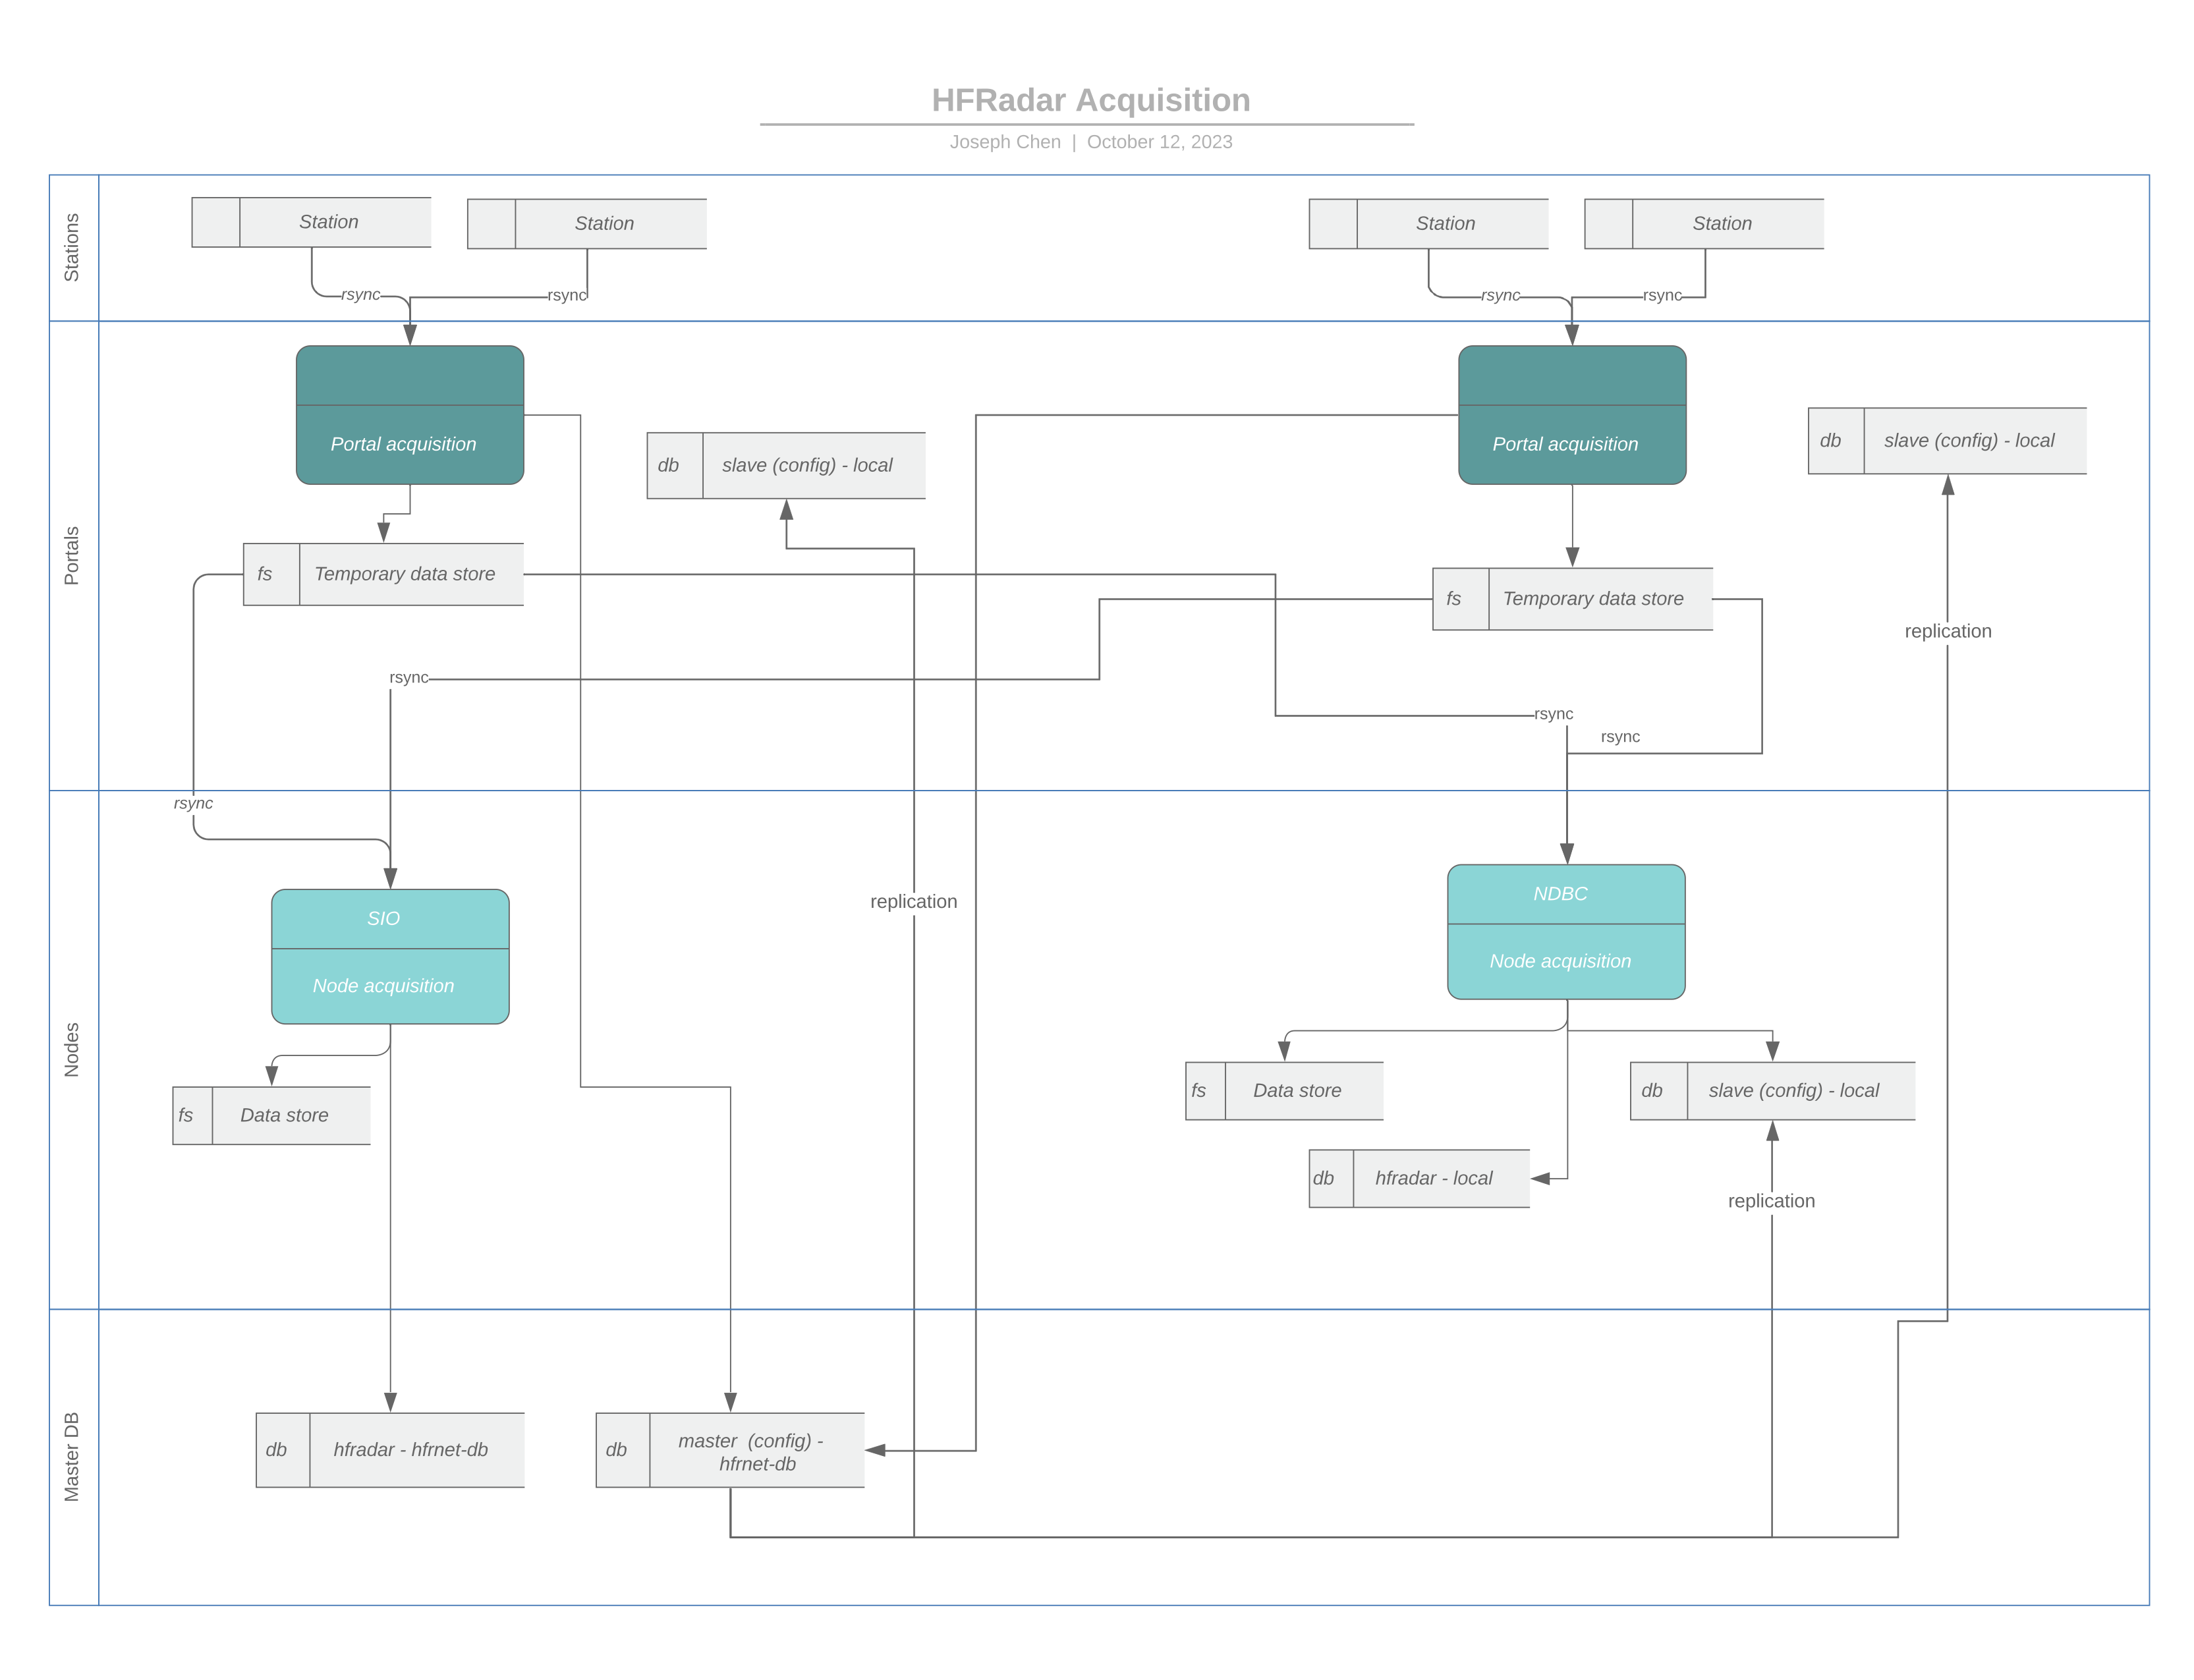
At its most basic level, the current implementation of HFRNet (Figure 1) can be thought of as consisting of two parts: “Portals” and “Nodes”. The HFRNet Portals and Nodes are physical Linux (CentOS) servers with SQL databases and code primarily written in Python and MATLAB. Access to the Portal and Node codebases is controlled by CORDC (not open source) and all operational documentation is internal to CORDC.

Portal Structure
Each oceanographic high-frequency radar (HFR) site provides its ocean surface current radial velocity data files in a standardized format that includes a number of metadata variables to a regional data portal that will ingest data from as many as 50 radars. These data portals are continuously monitored by processes that detect when new radial files arrive at the data portal. The radial files are then transported to the national servers, also known as data nodes.
Portals are currently operated by the following institutions:
- Monterey Bay Aquarium Research Institute
- Univ. of California, Santa Barbara
- Univ. of Miami
- Oregon State Univ.
- Univ. of Southern Mississippi
- Rutgers Univ.
- Univ. of California, San Diego
A “Portal” continuously aggregates the text files of surface current radial velocities, waves, and associated diagnostics generated by each HFR station in the National Network (Figure 2). SIO and 6 other IOOS partner institutions host Portals; CORDC runs them all (Figure 3). A portion of the Portal codebase may be previewed by downloading the .zip file within portal.
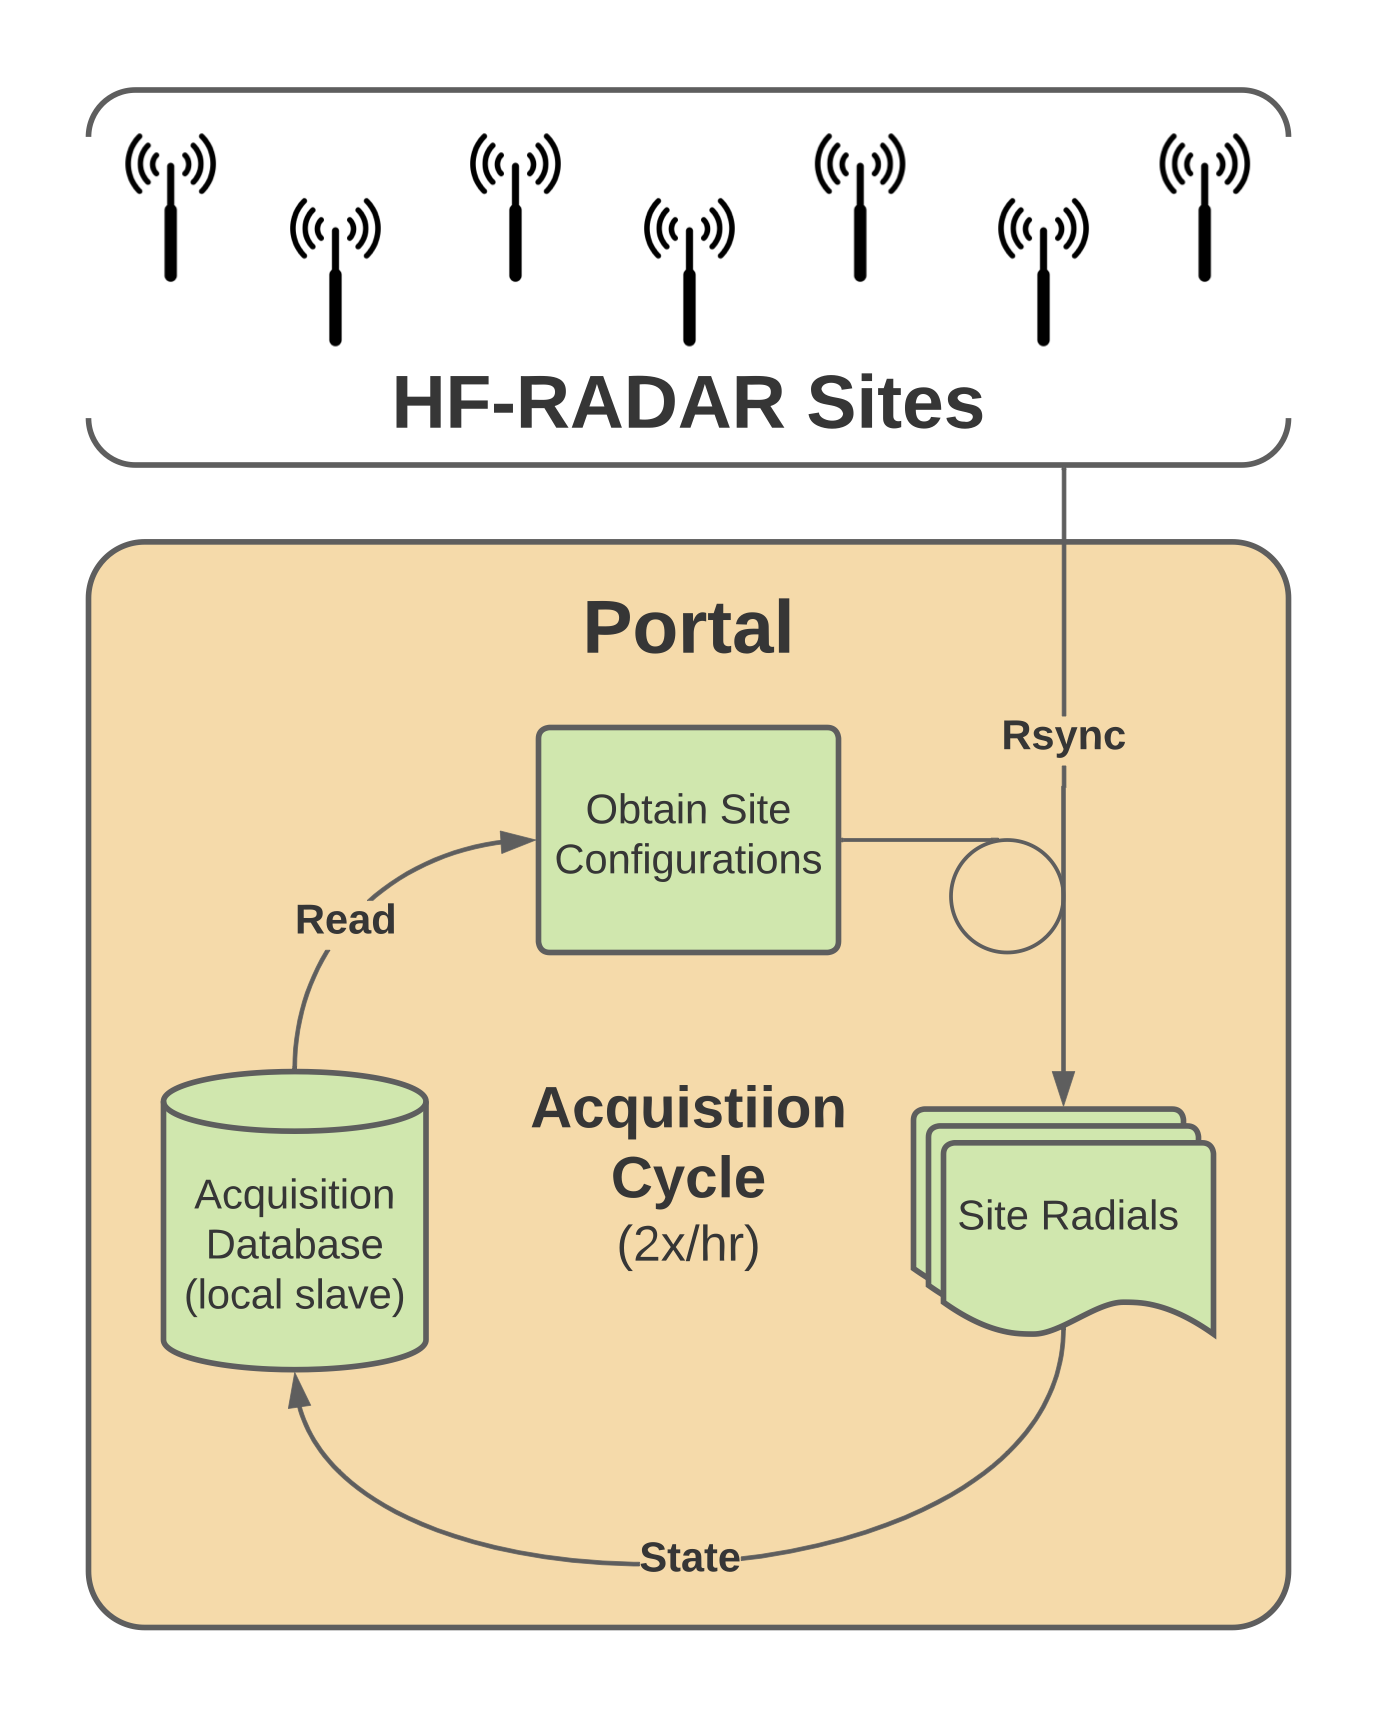
Figure 1. Diagram of a Portal’s acquisition of radial velocity text files from HFR sites. These aggregated “radials” get processed into totals by a “Node”. Click Portal Detail to view it at full size.
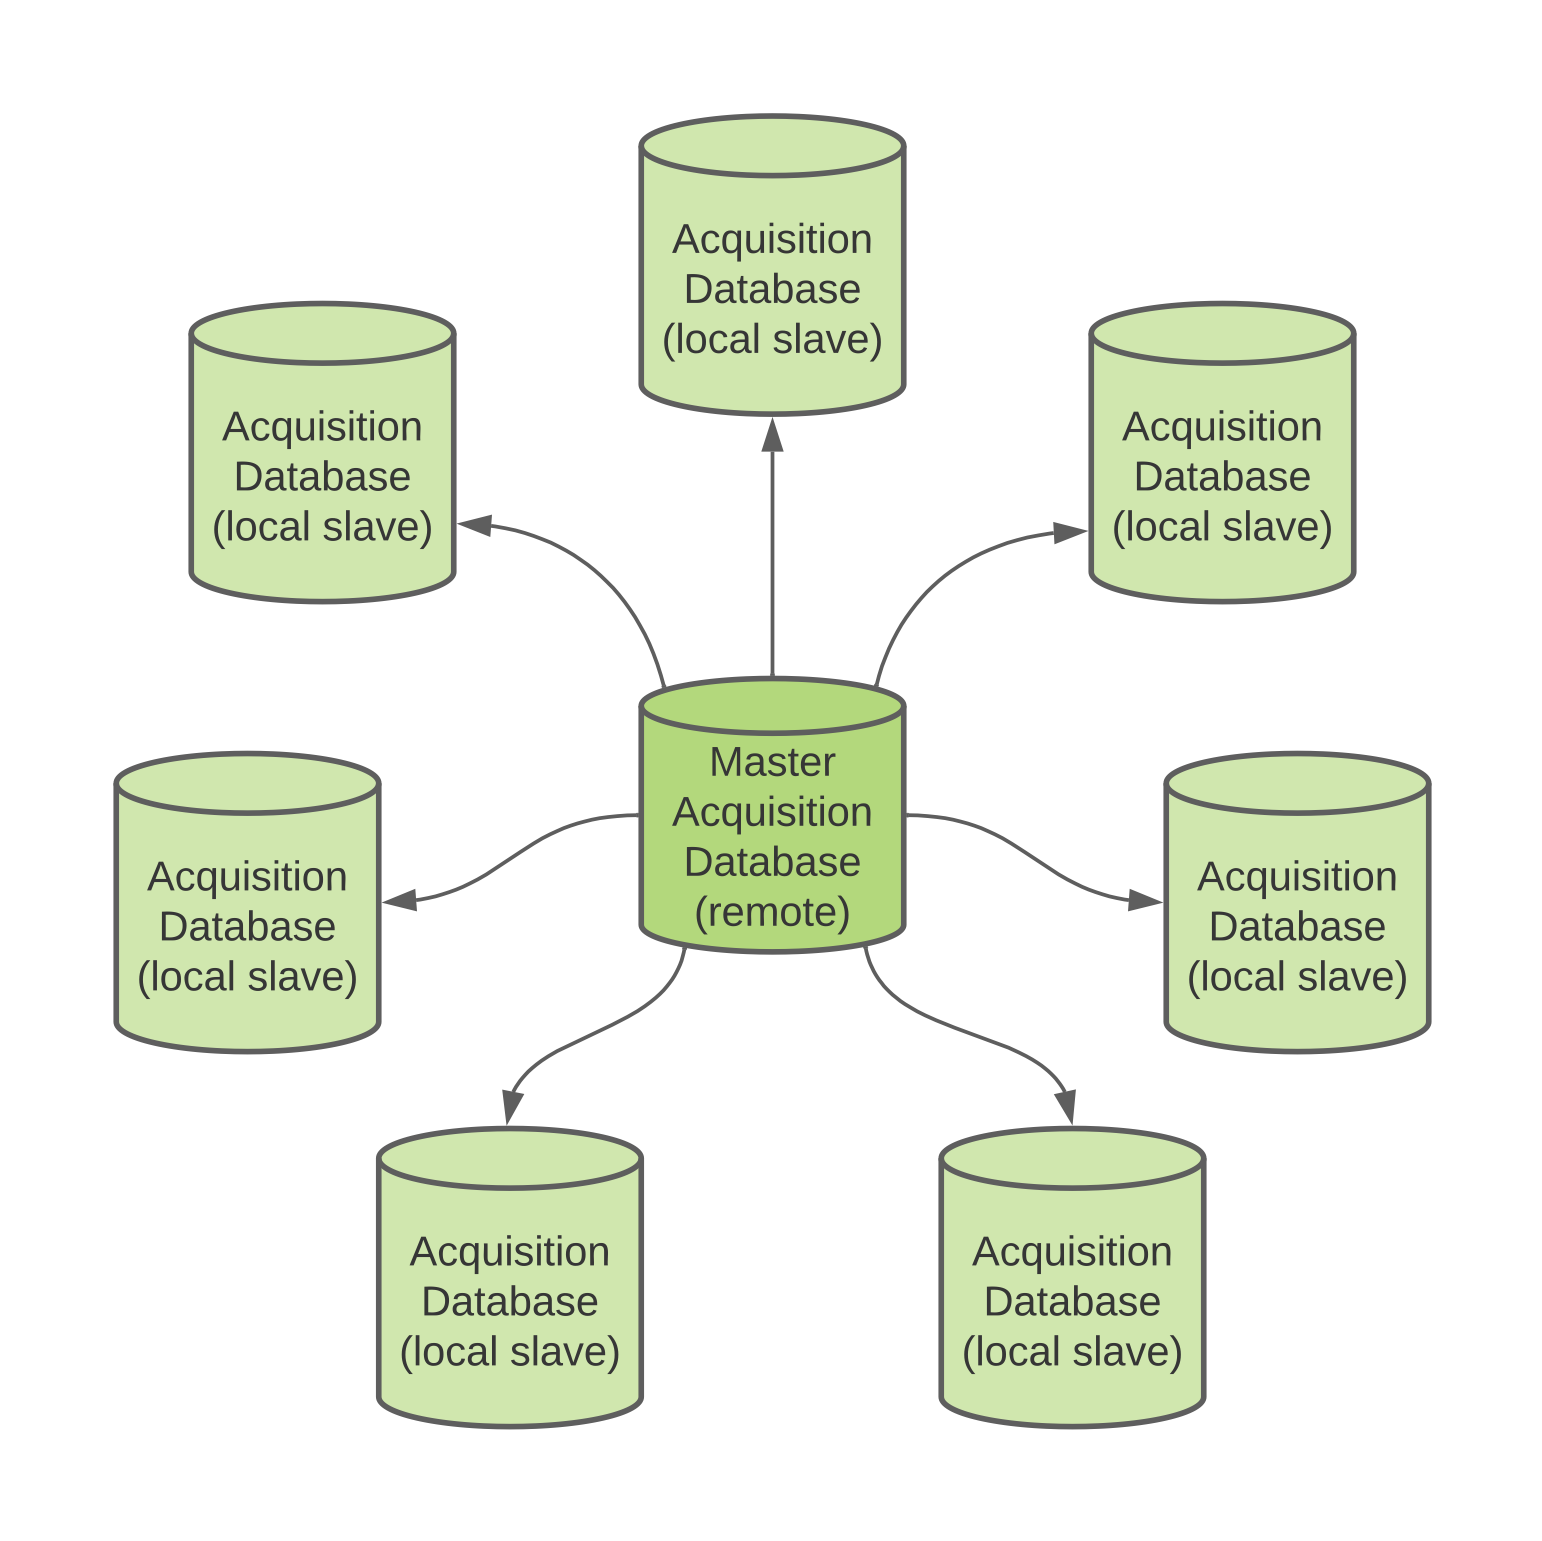
Figure 2. Diagram of the Portal configuration management schema. The CORDC Master Acquisition SQL Database synchronizes its changes with the Portals and Node at NDBC. Click Portal Configuration Management to view it at full size.
Node Structure
At the national server level, the radial velocity data are combined to form a gridded data set of total velocity (TV) vectors. These gridded data are comprised of three to four different grid resolutions. Far offshore, more than approximately 80 km, where only lower resolution radar data are available, the grid resolution is 6 km. From the nearshore to 80 km, the grid resolution is 2 km, while in some areas having higher resolution radars, the grid resolution is 1 km. In selected bays, where very high frequency (VHF) radars having short maximum ranges with sub-kilometer resolution are installed, the grid size is 500 m.
The gridded velocity data are then available for delivery to end-users, as input to both government and commercial/academic product development, and as input to circulation models or other operational models (e.g., HAB forecasting and search and rescue). The THREDDS (Thematic Real-time Environmental Distributed Data Services) data servers provide open data sharing, delivering HFR data for any member of the public to Find, Access, Interoperate, and Reuse (FAIR).
“Nodes” ingest the data aggregated by the portals, post-process, and error check it… then provide measurement maps and diagnostic visualizations; data server services (THREDDS) and data archival; and calculate performance/uptime statistics for the National Network (Figure 3). SIO and NDBC have Node servers; CORDC runs both. A portion of the Node codebase may be previewed by downloading the .zip file within node (Figure 3).
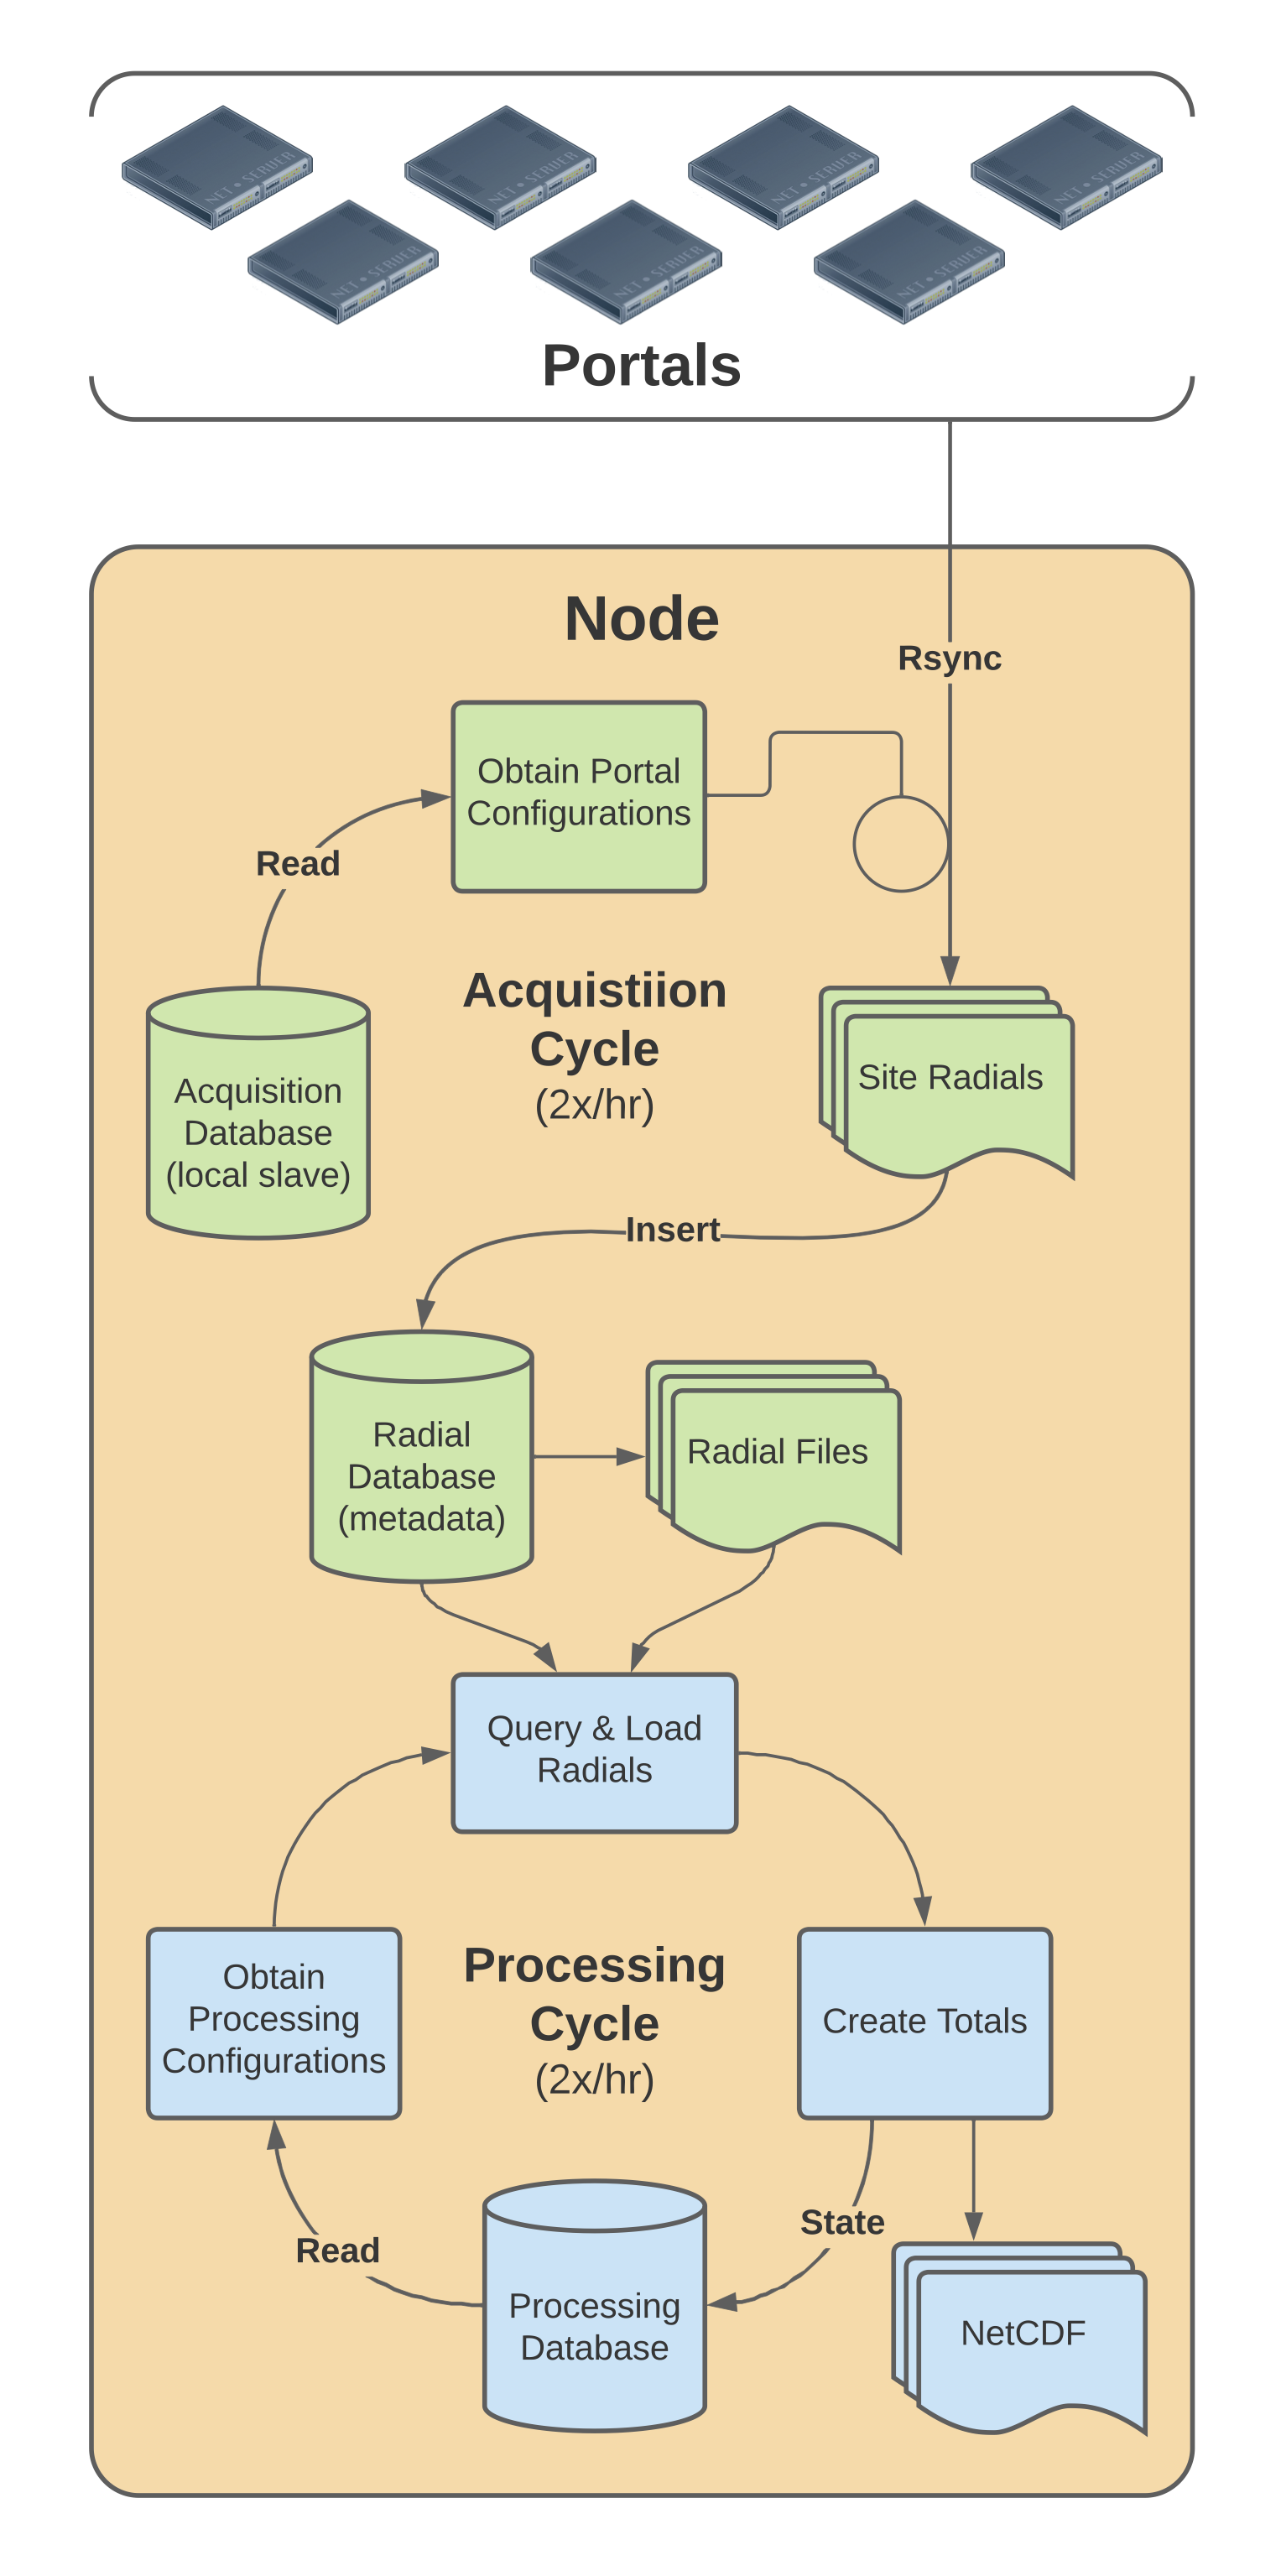
Figure 3. Diagram of a Node’s acquisition of radial velocity text files from Portals. These aggregated “radials” get processed into totals by the “Node”. Click to Node Detail to view it at full size.
Data Flow between Nodes and Portals
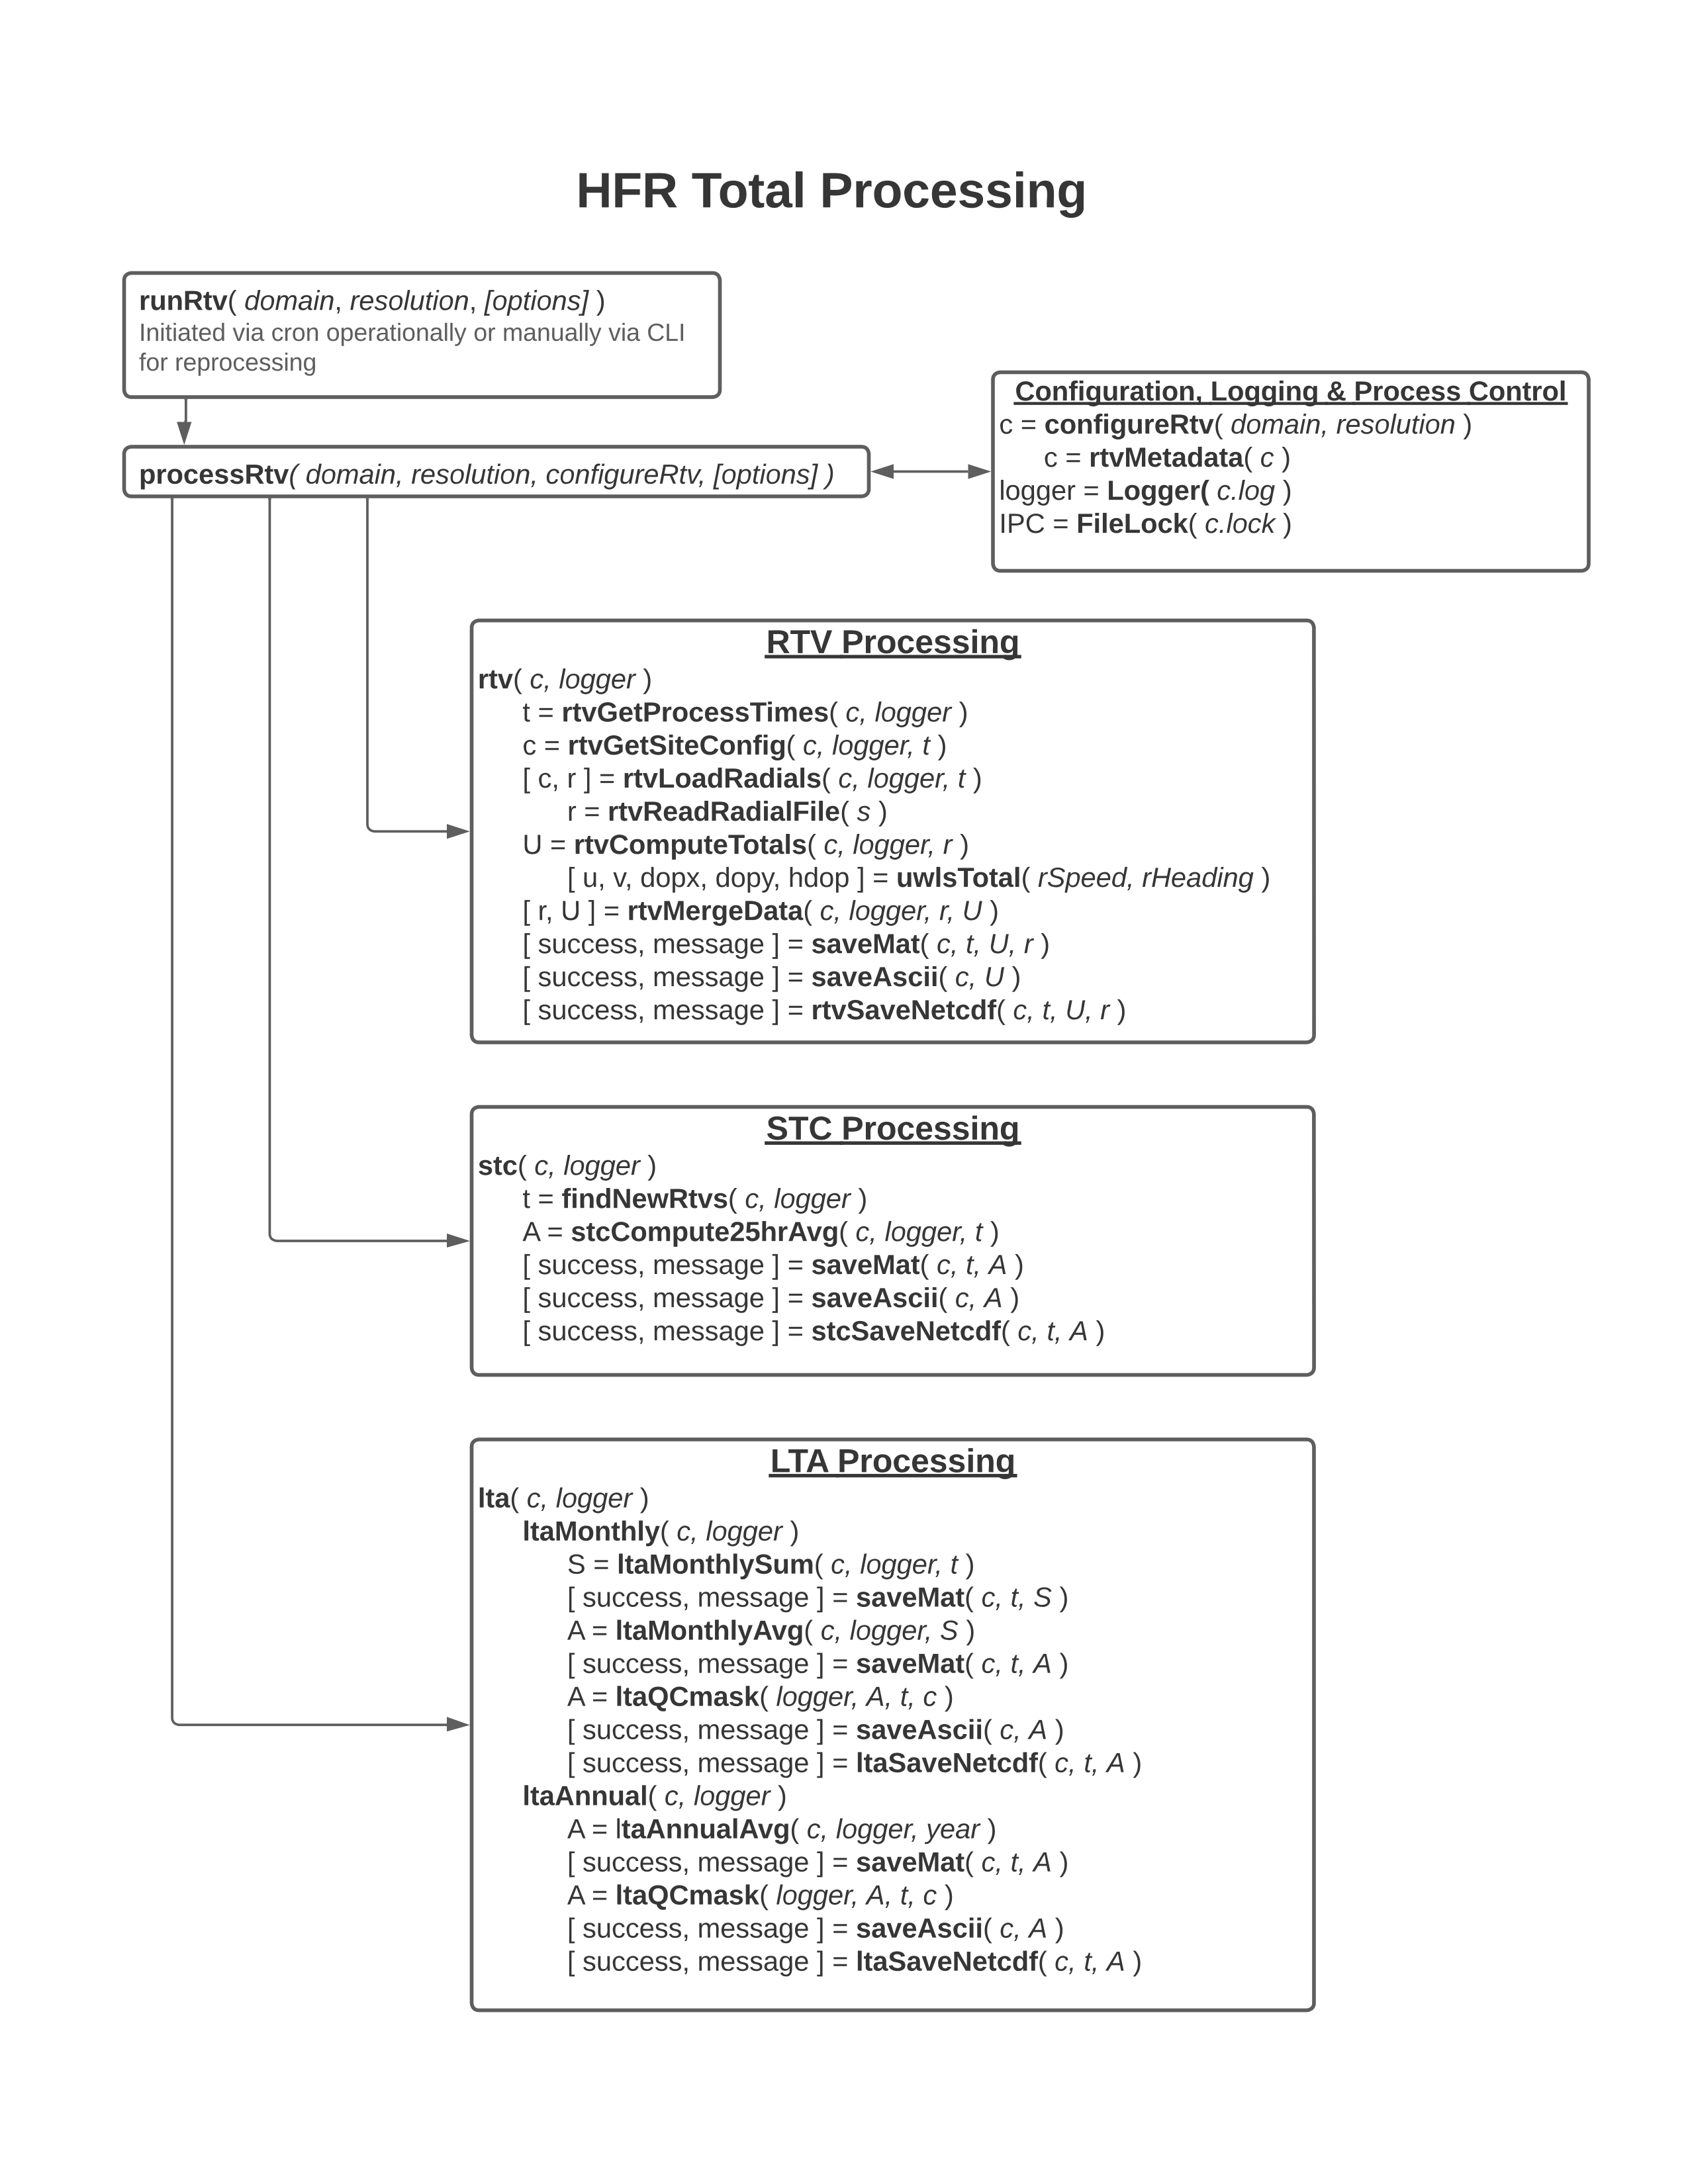
Real Time Vector Calculation
A primary function of the Node is to calculate total surface current vectors (“totals”) from the Portal’s aggregated radial velocities (“radials”) (Figure 4). The totals are provided as gridded regional products (hourly, 25-hour, and monthly averages) at various resolutions:
- Alaska North Slope: 6 km resolution grid
- Gulf of Alaska: 1 km, 2 km, and 6 km resolution grids
- U.S. West Coast: 500 m, 1 km, 2 km, and 6 km resolution grids
- U.S. East and Gulf Coast: 1 km, 2 km, and 6 km resolution grids
- Hawaii: 1 km, 2 km, and 6 km resolution grids
- Puerto and U.S. Virgin Islands: 2 km and 6 km resolution grids
- Great Lakes: 500 m, 1 km, 2 km, and 6 km resolution grids
Real Time Vector processing schematic
References
- https://cdn.ioos.noaa.gov/media/2017/12/hfradar_nodc_sep_2014.pdf
- https://ioos.noaa.gov/project/hf-radar/
- https://cdn.ioos.noaa.gov/media/2017/12/national_surface_current_planMay2015.pdf
- https://tidesandcurrents.noaa.gov/hfradar/