Fetching data from CO-OPS ERDDAP with Python tools#
Created: 2016-10-12
Updated: 2024-09-19
In this post we will use erddapy to find and download data from the
Center for Operational Oceanographic Products and Services (CO-OPS) ERDDAP server.
Here we will fetch data during the hurricane Matthew passage over the southeast states from 2016-10-05 to 2016-10-12. The first step is to instantiate the server object and then add the constraints for our query.
from erddapy import ERDDAP

e = ERDDAP(
    server="https://opendap.co-ops.nos.noaa.gov/erddap",
    protocol="tabledap",
)
The geographical bounding box includes all the states in the SECOORA region: Florida, Georgia, South and North Carolina.
min_lat, max_lat = 24.25, 36.70
min_lon, max_lon = -87.40, -74.70
import folium

lon = (min_lon + max_lon) / 2
lat = (min_lat + max_lat) / 2

m = folium.Map(location=[lat, lon], tiles="OpenStreetMap", zoom_start=5)

folium.Polygon(
    [(min_lat, min_lon), (max_lat, min_lon), (max_lat, max_lon), (min_lat, max_lon)],
    fill=True,
).add_to(m)

m
Unfortunately, as you’ll notice below, adding the bounding box as a constraint won’t help because this ERDDAP server requires the STATION_ID number as a mandatory argument for the request.
So, this means we need to know them before making the request and we cannot get them from the server.
e.constraints = {
    "BEGIN_DATE=": "20161004",
    "END_DATE=": "20161012",
    "DATUM=": "MSL",
}
We can check all the dataset_id that are available within those constraints with the search URL.
import pandas as pd

df = pd.read_csv(e.get_search_url(response="csv"))
df["Dataset ID"]
0                                 allDatasets
1                                IOOS_Air_Gap
2                    IOOS_Raw_Currents_Header
3                           IOOS_Raw_Currents
4                        IOOS_Air_Temperature
5                    IOOS_Barometric_Pressure
6                           IOOS_Conductivity
7                      IOOS_Relative_Humidity
8                             IOOS_Visibility
9                      IOOS_Water_Temperature
10                                  IOOS_Wind
11               IOOS_Raw_One_Min_Water_Level
12                       IOOS_Raw_Water_Level
13            IOOS_Daily_Verified_Water_Level
14         IOOS_High_Low_Verified_Water_Level
15    IOOS_Hourly_Height_Verified_Water_Level
16          IOOS_Monthly_Verified_Water_Level
17           IOOS_SixMin_Verified_Water_Level
Name: Dataset ID, dtype: object
We want the dataset_id = IOOS_Hourly_Height_Verified_Water_Level to check the hourly sea surface height time-series. However, we still do not know the actual variable name. Unfortunately, the Climate and Forecast conventions (CF) do not define the variable names but it does define some variable metadata attributes like standard_name, making it easy to check what is in a dataset. The data we are looking for should be associated with the CF standard_name = water_surface_height_above_reference_datum.
In erddapy one can query the available variables for a standard name with the method get_var_by_attr.
dataset_id = "IOOS_Hourly_Height_Verified_Water_Level"
std_name = "water_surface_height_above_reference_datum"

e.dataset_id = dataset_id

variables = e.get_var_by_attr(standard_name=std_name)

print(f"Found {','.join(variables)} variable(s) in the dataset.")


variables.extend(["time"])  # we also want to download the time.
e.variables = variables
Found WL_VALUE variable(s) in the dataset.
We found 1 variable, which makes our job easier, and now we can query the data for it.
Now we need to get a list of stations that are within our bounding box.
If we look the STATION_ID metadata we see a link to a page with the stations and their sensors listing.
info = pd.read_csv(e.get_info_url(response="csv"))
station_id_info = info.loc[info["Variable Name"] == "STATION_ID"]

station_id_info
| Row Type | Variable Name | Attribute Name | Data Type | Value | |
|---|---|---|---|---|---|
| 15 | variable | STATION_ID | NaN | String | NaN |
| 16 | attribute | STATION_ID | cf_role | String | timeseries_id |
| 17 | attribute | STATION_ID | comment | String | To view the station id listing go to: https://... |
| 18 | attribute | STATION_ID | ioos_category | String | Identifier |
| 19 | attribute | STATION_ID | long_name | String | REQUIRED 7-character Station ID surrounded in ... |
print(
    station_id_info.loc[station_id_info["Attribute Name"] == "comment"][
        "Value"
    ].squeeze()
)
To view the station id listing go to: https://opendap.co-ops.nos.noaa.gov/stations/index.jsp
In that page we have the option to view stations information as XML (stationsXML).
Luckily we can easily parse the stationsXML file and filter out the stations we want.
url = "https://opendap.co-ops.nos.noaa.gov/stations/stationsXML.jsp"


names = pd.read_xml(
    url,
    namespaces={"xsi": "http://www.w3.org/2001/XMLSchema-instance"},
)[["name", "ID"]]


locations = pd.read_xml(url, xpath='//*[contains(name(),"location")]')

df = pd.concat([names, locations], axis=1)
Now we can filter the stations that are inside our bounding box.
mask = (
    (df["lat"] >= min_lat)
    & (df["lat"] <= max_lat)
    & (df["long"] >= min_lon)
    & (df["long"] <= max_lon)
)

df = df[mask]

print(
    f"We filtered out all stations but those from {', '.join(filter(None, set(df['state'])))} states."
)
We filtered out all stations but those from FL, SC, GA, NC states.
That looks correct. We want only the stations that are part of the SECOORA region.
data = {}

for station_id in df["ID"]:
    e.constraints.update({"STATION_ID=": f"{station_id}"})
    try:
        series = e.to_pandas(index_col="time (UTC)", parse_dates=True)
        data.update({station_id: series})
    except Exception:
        missing = df.loc[df["ID"] == station_id][["name", "ID"]].squeeze().tolist()
        print(
            f"Could not get data for {missing[0]} id {missing[1]} using the URL:\n\n"
            f"{e.get_download_url()}\n"
        )
        pass

water_level = pd.concat(data, axis=1)

# Remove the units and leave only the station number.
water_level.columns = [col[0] for col in water_level.columns]
Could not get data for JENNETTE'S PIER id 8652226 using the URL:

https://opendap.co-ops.nos.noaa.gov/erddap/tabledap/IOOS_Hourly_Height_Verified_Water_Level.html?WL_VALUE,time&BEGIN_DATE="20161004"&END_DATE="20161012"&DATUM="MSL"&STATION_ID="8652226"

Could not get data for Don Holt Bridge Air Gap id 8664753 using the URL:

https://opendap.co-ops.nos.noaa.gov/erddap/tabledap/IOOS_Hourly_Height_Verified_Water_Level.html?WL_VALUE,time&BEGIN_DATE="20161004"&END_DATE="20161012"&DATUM="MSL"&STATION_ID="8664753"

Could not get data for Ravenel Bridge Air Gap id 8665353 using the URL:

https://opendap.co-ops.nos.noaa.gov/erddap/tabledap/IOOS_Hourly_Height_Verified_Water_Level.html?WL_VALUE,time&BEGIN_DATE="20161004"&END_DATE="20161012"&DATUM="MSL"&STATION_ID="8665353"

Could not get data for Talmadge Memorial Bridge Air Gap id 8670674 using the URL:

https://opendap.co-ops.nos.noaa.gov/erddap/tabledap/IOOS_Hourly_Height_Verified_Water_Level.html?WL_VALUE,time&BEGIN_DATE="20161004"&END_DATE="20161012"&DATUM="MSL"&STATION_ID="8670674"

Could not get data for Kings Bay MSF Pier id 8679598 using the URL:

https://opendap.co-ops.nos.noaa.gov/erddap/tabledap/IOOS_Hourly_Height_Verified_Water_Level.html?WL_VALUE,time&BEGIN_DATE="20161004"&END_DATE="20161012"&DATUM="MSL"&STATION_ID="8679598"

Could not get data for Navy Fuel Depot id 8720215 using the URL:

https://opendap.co-ops.nos.noaa.gov/erddap/tabledap/IOOS_Hourly_Height_Verified_Water_Level.html?WL_VALUE,time&BEGIN_DATE="20161004"&END_DATE="20161012"&DATUM="MSL"&STATION_ID="8720215"

Could not get data for Little Jetties Visibility id 8720228 using the URL:

https://opendap.co-ops.nos.noaa.gov/erddap/tabledap/IOOS_Hourly_Height_Verified_Water_Level.html?WL_VALUE,time&BEGIN_DATE="20161004"&END_DATE="20161012"&DATUM="MSL"&STATION_ID="8720228"

Could not get data for Blount Island Command id 8720233 using the URL:

https://opendap.co-ops.nos.noaa.gov/erddap/tabledap/IOOS_Hourly_Height_Verified_Water_Level.html?WL_VALUE,time&BEGIN_DATE="20161004"&END_DATE="20161012"&DATUM="MSL"&STATION_ID="8720233"

Could not get data for Jacksonville University id 8720245 using the URL:

https://opendap.co-ops.nos.noaa.gov/erddap/tabledap/IOOS_Hourly_Height_Verified_Water_Level.html?WL_VALUE,time&BEGIN_DATE="20161004"&END_DATE="20161012"&DATUM="MSL"&STATION_ID="8720245"

Could not get data for Dames Point Bridge Air Gap id 8720376 using the URL:

https://opendap.co-ops.nos.noaa.gov/erddap/tabledap/IOOS_Hourly_Height_Verified_Water_Level.html?WL_VALUE,time&BEGIN_DATE="20161004"&END_DATE="20161012"&DATUM="MSL"&STATION_ID="8720376"

Could not get data for South Port Everglades id 8722956 using the URL:

https://opendap.co-ops.nos.noaa.gov/erddap/tabledap/IOOS_Hourly_Height_Verified_Water_Level.html?WL_VALUE,time&BEGIN_DATE="20161004"&END_DATE="20161012"&DATUM="MSL"&STATION_ID="8722956"

Could not get data for NAPLES BAY, NORTH id 8725114 using the URL:

https://opendap.co-ops.nos.noaa.gov/erddap/tabledap/IOOS_Hourly_Height_Verified_Water_Level.html?WL_VALUE,time&BEGIN_DATE="20161004"&END_DATE="20161012"&DATUM="MSL"&STATION_ID="8725114"

Could not get data for Sunshine Skyway Bridge Air Gap id 8726371 using the URL:

https://opendap.co-ops.nos.noaa.gov/erddap/tabledap/IOOS_Hourly_Height_Verified_Water_Level.html?WL_VALUE,time&BEGIN_DATE="20161004"&END_DATE="20161012"&DATUM="MSL"&STATION_ID="8726371"

Could not get data for Middle Tampa Bay id 8726412 using the URL:

https://opendap.co-ops.nos.noaa.gov/erddap/tabledap/IOOS_Hourly_Height_Verified_Water_Level.html?WL_VALUE,time&BEGIN_DATE="20161004"&END_DATE="20161012"&DATUM="MSL"&STATION_ID="8726412"

Could not get data for Cut D Channel, Inbound Rear Range id 8726504 using the URL:

https://opendap.co-ops.nos.noaa.gov/erddap/tabledap/IOOS_Hourly_Height_Verified_Water_Level.html?WL_VALUE,time&BEGIN_DATE="20161004"&END_DATE="20161012"&DATUM="MSL"&STATION_ID="8726504"

Could not get data for Sparkman Channel Entrance id 8726671 using the URL:

https://opendap.co-ops.nos.noaa.gov/erddap/tabledap/IOOS_Hourly_Height_Verified_Water_Level.html?WL_VALUE,time&BEGIN_DATE="20161004"&END_DATE="20161012"&DATUM="MSL"&STATION_ID="8726671"

Could not get data for East Bay id 8726674 using the URL:

https://opendap.co-ops.nos.noaa.gov/erddap/tabledap/IOOS_Hourly_Height_Verified_Water_Level.html?WL_VALUE,time&BEGIN_DATE="20161004"&END_DATE="20161012"&DATUM="MSL"&STATION_ID="8726674"

Could not get data for East Bay Causeway id 8726679 using the URL:

https://opendap.co-ops.nos.noaa.gov/erddap/tabledap/IOOS_Hourly_Height_Verified_Water_Level.html?WL_VALUE,time&BEGIN_DATE="20161004"&END_DATE="20161012"&DATUM="MSL"&STATION_ID="8726679"

Could not get data for TPA Cruise Terminal 2 id 8726694 using the URL:

https://opendap.co-ops.nos.noaa.gov/erddap/tabledap/IOOS_Hourly_Height_Verified_Water_Level.html?WL_VALUE,time&BEGIN_DATE="20161004"&END_DATE="20161012"&DATUM="MSL"&STATION_ID="8726694"
Many requests failed because we don’t know if the data for that station exists in the date range we requested. That ERDDAP server is not configured to use what ERDDAP does best, high queries using the metadata.
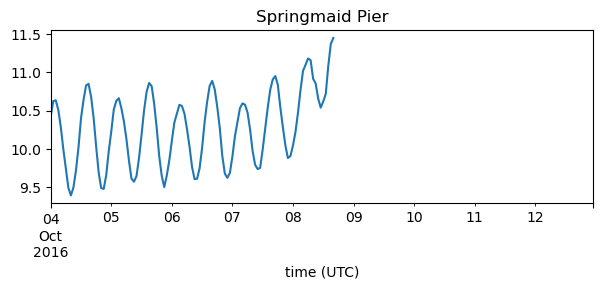
Now that we have the data we can, for example, check the station with the highest sea elevation.
def get_station_name(station_id):
    return df.loc[df["ID"] == station_id]["name"].squeeze()


station_id = water_level.max(axis=0).idxmax()

ax = water_level[station_id].plot(figsize=(7, 2.25))
title = ax.set_title(get_station_name(station_id))
Let’s plot the stations from North Carolina so we can compare with Fort Pulaski, GA.
import matplotlib.pyplot as plt

station_ids = df.loc[df["state"] == "NC"]["ID"]

fig, axes = plt.subplots(
    nrows=len(station_ids), sharex=True, sharey=True, figsize=(11, 2.25 * 5)
)

for k, station_id in enumerate(station_ids):
    if station_id in water_level.columns:
        series = water_level[station_id]
        series.plot(ax=axes[k])
        axes[k].text(series.index[20], 1.5, get_station_name(station_id))
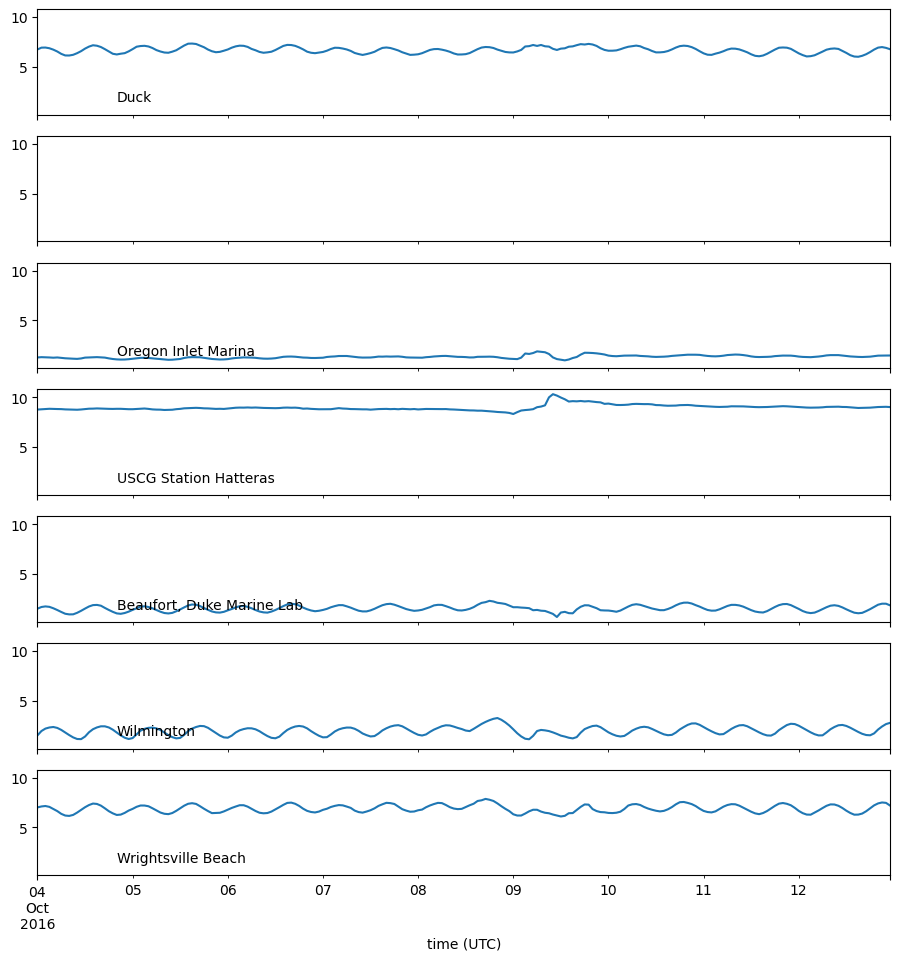
Ideally we should filter out the tides in order to better interpret the storm surges. We’ll leave that as an exercise to the readers.
In order to easily explore all the stations we can put together an interactive map with the stations positions and the elevation time-series.
This can be done using the software package bokeh and the mapping library folium.
from bokeh.embed import file_html
from bokeh.plotting import figure
from bokeh.resources import CDN
from folium import IFrame

# Plot defaults.
tools = "pan,box_zoom,reset"
width, height = 750, 250


def make_plot(series):
    p = figure(
        toolbar_location="above",
        x_axis_type="datetime",
        width=width,
        height=height,
        tools=tools,
        title=f"{get_station_name(series.name)} ({series.name})",
    )
    line = p.line(
        x=series.index,
        y=series.values,
        line_width=5,
        line_cap="round",
        line_join="round",
    )
    return p, line


def make_marker(p, location, fname):
    html = file_html(p, CDN, fname)
    iframe = IFrame(html, width=width + 45, height=height + 80)

    popup = folium.Popup(iframe, max_width=2650)
    icon = folium.Icon(color="green", icon="stats")
    marker = folium.Marker(location=location, popup=popup, icon=icon)
    return marker
lon = (min_lon + max_lon) / 2
lat = (min_lat + max_lat) / 2

m = folium.Map(location=[lat, lon], tiles="OpenStreetMap", zoom_start=5)

for station_id, series in water_level.items():
    location = df.loc[df["ID"] == station_id][["lat", "long"]].squeeze().tolist()
    p, _ = make_plot(series.tz_localize(None))
    marker = make_marker(p, location=location, fname=station_id)
    marker.add_to(m)

m